

Currently Empty: ₹0.00


IELTS
IELTS Academic Writing Task 1: Describing Graphs, Charts, and Tables

Introduction
IELTS Academic Writing Task 1 is a crucial part of the exam that tests your ability to interpret and describe visual data effectively. Whether it’s graphs, charts, or tables, mastering this task can significantly improve your writing band score. In this blog, we’ll break down everything you need to know about IELTS Academic Writing Task 1—from identifying key data to organizing your response for clarity and impact.
Understanding IELTS Academic Writing Task 1
In the IELTS Academic Writing Task 1 section, candidates are given a visual representation of data, such as a chart, graph, or table. Your task is to summarize this information accurately, focusing on trends, comparisons, and key features without including personal opinions.
IELTS Academic Writing Task 1 evaluates your ability to:
- Identify key information
- Summarize data effectively
- Structure your response logically
Types of Visual Data in IELTS Academic Writing Task 1
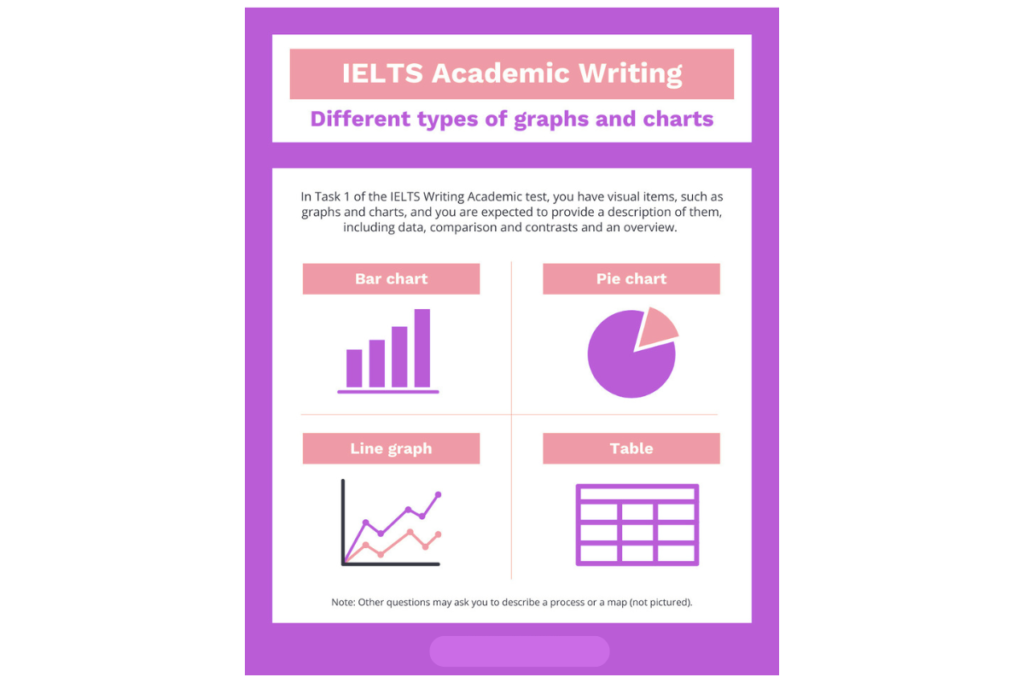
Be familiar with the types of visuals you may encounter:
- Bar Charts: Compare data across categories.
- Line Graphs: Show changes over time.
- Pie Charts: Illustrate proportions or percentages.
- Tables: Present numerical data in rows and columns.
- Diagrams or Flow Charts: Represent processes or instructions.
Key Strategies for IELTS Academic Writing Task 1
1. Analyze the Data Carefully
Before writing, examine the visual carefully:
- Look for trends
- Note comparisons
- Identify any anomalies
2. Organize Your Response
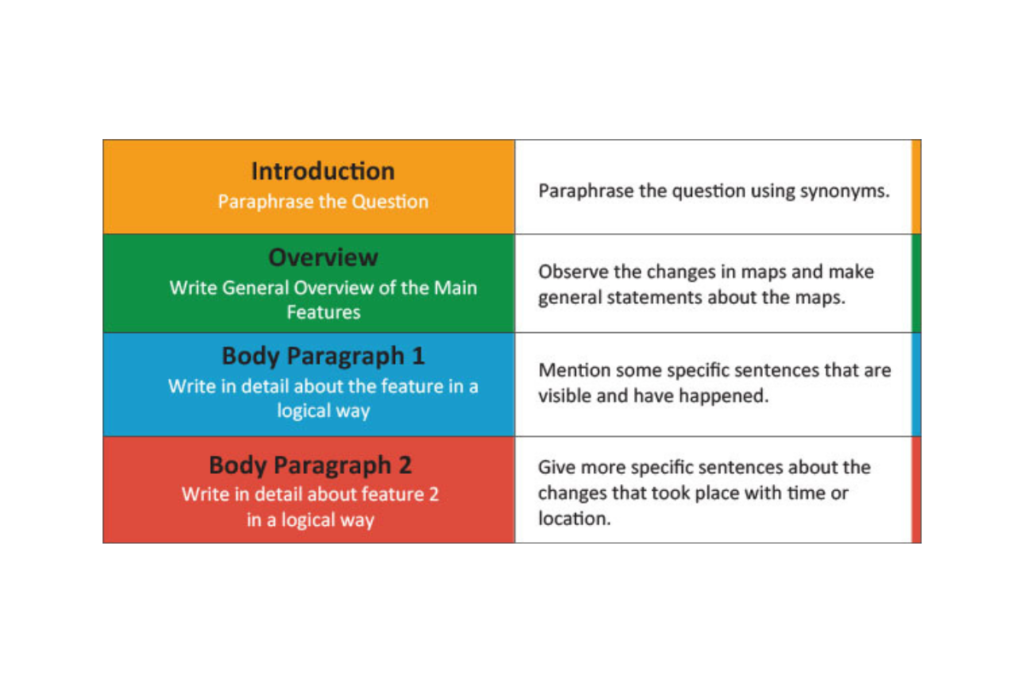
A strong IELTS Academic Writing Task 1 response includes:
- Introduction: Paraphrase the question and describe what the graph or chart shows.
- Overview: Summarize the main features or trends.
- Body Paragraphs: Provide specific comparisons and details
3. Use a Wide Range of Vocabulary
Expand your vocabulary to accurately describe data:
- Increase: rise, grow, surge
- Decrease: fall, decline, drop
- Stability: remain constant, level off
4. Report Accurate Data
Use exact numbers and percentages shown in the visual.
5. Avoid Personal Opinions
Focus strictly on the data. IELTS Academic Writing Task 1 is objective.
Examples of IELTS Academic Writing Task 1 Descriptions
- Bar Chart Example: “The bar chart displays book sales over six months. Sales peaked in March at 10,000 units and dropped to 3,000 in June.”
- Line Graph Example: “The line graph shows temperature trends over the year. July recorded the highest average of 30°C, while January was the coldest.”
- Table Example: “The table compares student scores. Math scored highest at 85%, followed by Science at 75%.”
Common Mistakes in IELTS Academic Writing Task 1
Many students struggle with:
- Describing too much irrelevant detail
- Lacking structure in their responses
- Repeating vocabulary
The solution? Focus on key trends and clear organization.
Simplified Summary
IELTS Academic Writing Task 1 requires you to:
- Understand and summarize visual data
- Organize your writing with an intro, overview, and detailed paragraphs
- Use accurate vocabulary
- Avoid personal views
How Academy 24 Helps You Excel in IELTS Academic Writing Task 1

At Academy 24, we provide expert coaching on IELTS Academic Writing Task 1. With personalized feedback, targeted lessons, and real practice examples, we guide students to improve their writing scores and overall IELTS performance. Whether you’re working on Task 1 or the full test, our resources are built to help you succeed.
External Resources
Conclusion
Mastering IELTS Academic Writing Task 1 is all about strategy, structure, and practice. By focusing on what matters most in the visual data and organizing your response clearly, you can significantly increase your writing band score. Don’t forget to practice regularly and seek expert guidance when needed. Academy 24 is here to support you every step of the way on your IELTS journey.